First, let's take a look at the macros. Each of these are listed in grams and as usual, normalized to 200 calories for easy comparison, so we're always comparing apples to apples.
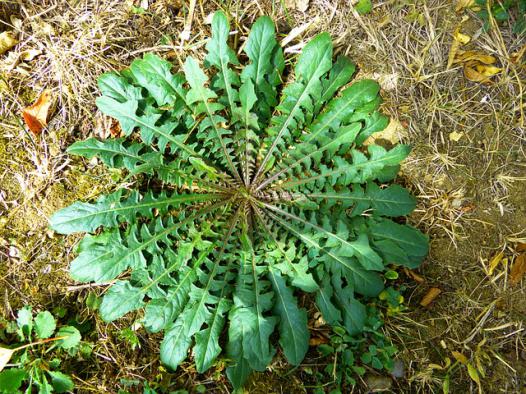
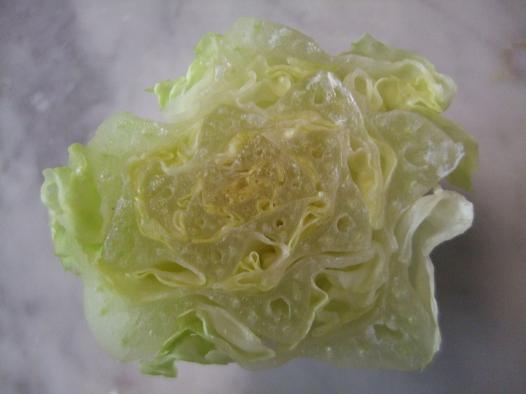
| Dandelion greens | Romaine lettuce |
| Nutrient | dandelion greens | romaine lettuce |
| Protein | 12g | 14g |
| Carbohydrate | 41g | 39g |
| Fiber | 16g | 25g |
| Fat | 3g | 4g |
| Monounsat. Fat | 0g | 4g |
| Polyunsat. Fat | 1g | 2g |
| Saturated Fat | 1g | 0g |
Next, let's take a look at the Vitamin density. These values are shown in units of percent of recommended daily intake. And since we're showing 200 calories worth, this means anything above 10% is good.
| Nutrient | dandelion greens | romaine lettuce |
| Choline | 37% | 28% |
| Vitamin A | 361% | 821% |
| Vitamin C | 207% | 376% |
| Vitamin E | 127% | 13% |
| Vitamin K | 4324% | 1507% |
Dandelion greens have significantly more Vitamins E, K than romaine lettuce. Romaine lettuce have significantly more Vitamins A, C than dandelion greens. Dandelion greens are a good source of Niacin. Dandelion greens are a great source of Thiamin, Potassium, Magnesium, Phosphorus. Dandelion greens are an excellent source of Vitamin A, Vitamin E, Vitamin K, Vitamin C, Riboflavin, Vitamin B6, Calcium, Iron. Romaine lettuce are a good source of Niacin, Pantothenic Acid, Zinc. Romaine lettuce are a great source of Thiamin, Riboflavin, Vitamin B6, Potassium, Magnesium, Calcium, Phosphorus. Romaine lettuce are an excellent source of Vitamin A, Vitamin K, Vitamin C, Iron.
And here we see the B-vitamins: B1 (Thiamin), B2 (Riboflavin), B3 (Niacin), B5 (Pantothenic Acid), B6 (Pyridoxine)
| Nutrient | dandelion greens | romaine lettuce |
| Vitamin B1 | 84% | 85% |
| Vitamin B2 | 105% | 72% |
| Vitamin B3 | 30% | 31% |
| Vitamin B5 | 8% | 33% |
| Vitamin B6 | 101% | 79% |
| Vitamin B12 | 0% | 0% |
Now, lets look at mineral density. Here we have a lot of important electrolytes and minerals. Once again, units are in percent of RDI, thus for this 200 calorie serving anything above 10% would considered high.
| Nutrient | dandelion greens | romaine lettuce |
| Sodium | 23% | 6% |
| Potasium | 50% | 83% |
| Calcium | 166% | 78% |
| Magnesium | 46% | 47% |
| Phosphorus | 51% | 61% |
| Iron | 230% | 190% |
| Manganese | 66% | 79% |
| Selenium | 5% | 10% |
| Copper | 76% | 56% |
| Zinc | 19% | 29% |
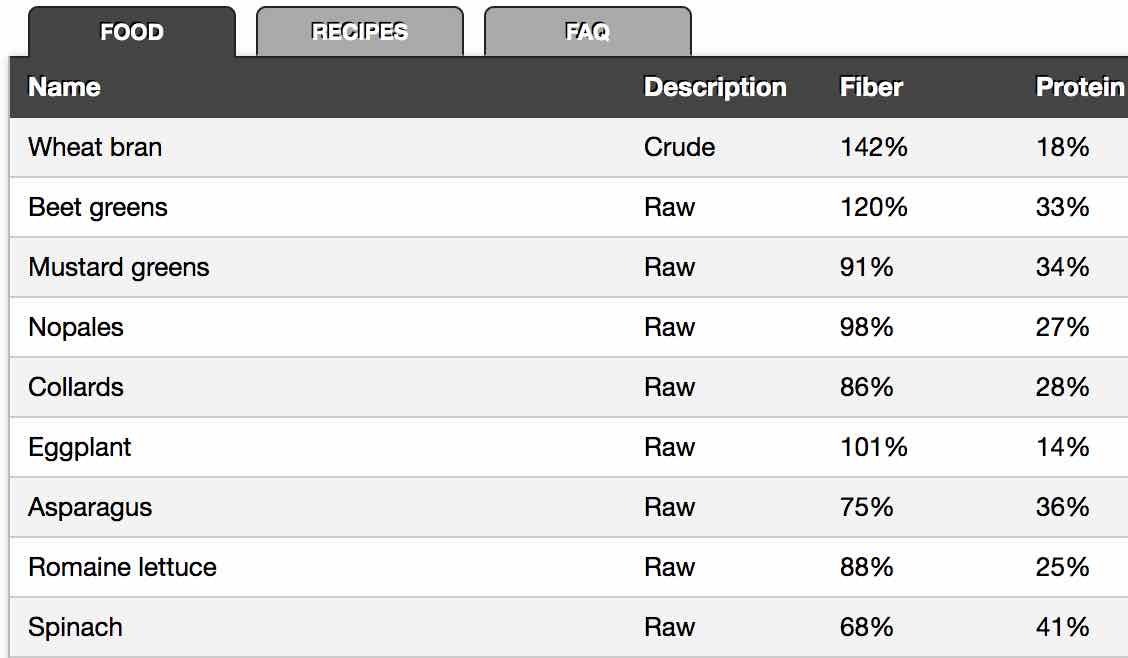
Rank foods/recipes by Nutrients
You can use the Nutrient based Food and recipe finder, to rank foods based on nutrients:
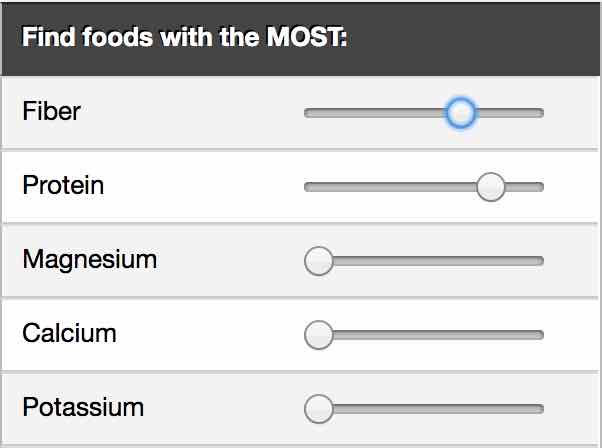
And get results like this: